


Can You Predict a Damper Curve Before You Build the Shock?

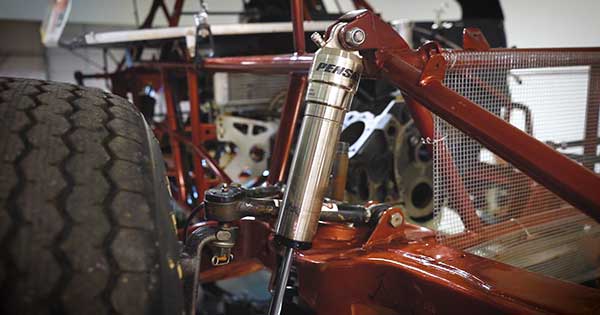
A damper curve is a plot of the force a shock produces against the speed at which its shaft is moving. It is the main document engineers use to describe shock behavior, compare one build against another, and decide what to change. Producing a damper curve requires a shock dyno, which is a machine that strokes the shock through a controlled motion at known velocities while measuring the force it generates in response.
Under normal shop practice, the only way to learn what curve a particular shock build will produce is to assemble that shock and test it. An engineer decides on a combination of internal components, a technician builds the shock, the shock goes on the dyno, and the curve either matches the target or it does not. When it does not, the shock comes apart and the process repeats with different components.
This article explains why that process is difficult to shortcut, and whether a damper curve can be predicted from a build specification before the shock is assembled. It also covers DCML, the machine learning module inside PASS, the shock dyno analysis software Penske Racing Shocks built to replace Shock 6, including how accurate its predictions are and where they stop being reliable.
What a damper curve shows
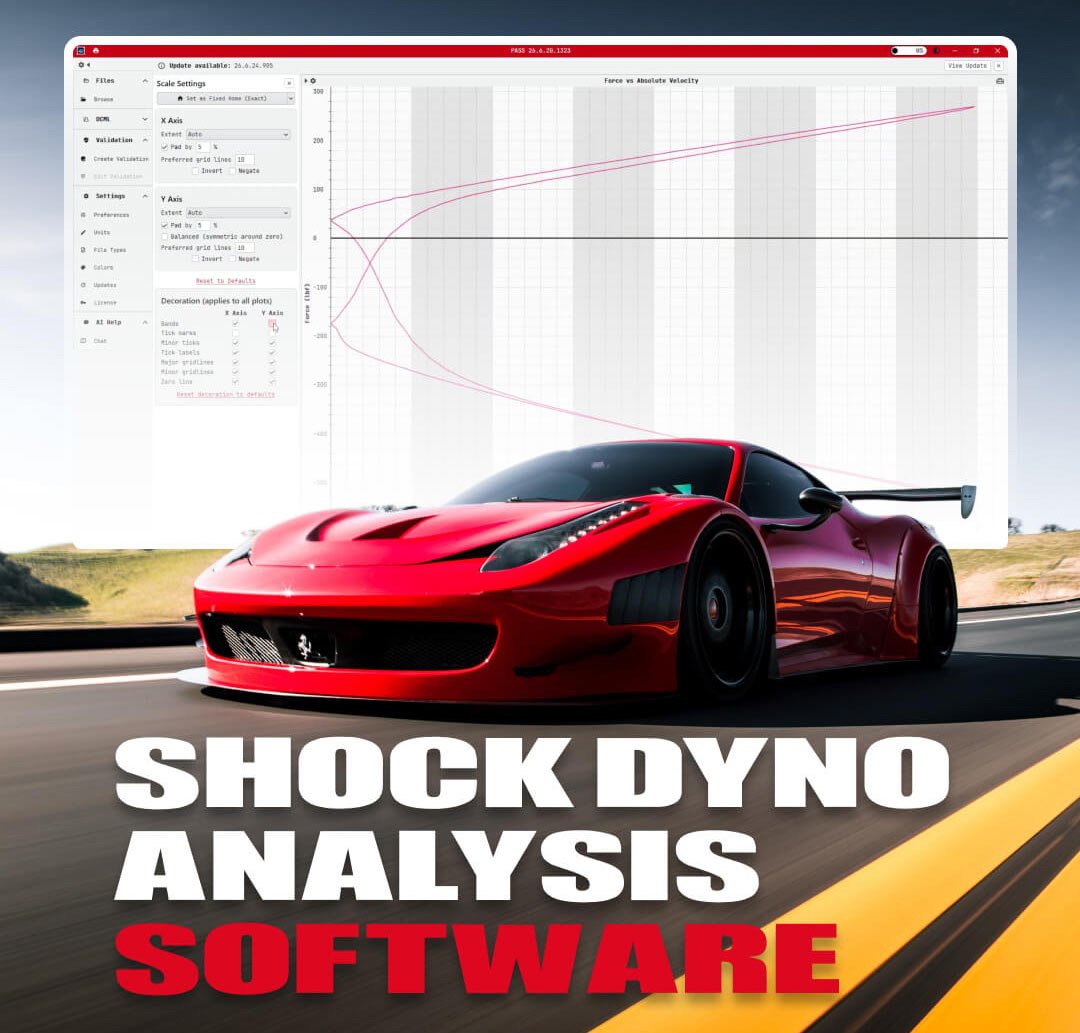
The horizontal axis of a damper curve is shaft velocity, usually measured in inches or millimeters per second. The vertical axis is force, usually in pounds or newtons. A single curve therefore answers the question of how much resistance the shock produces at any given speed of shaft movement.
Engineers divide the curve into two regions because they correspond to different things happening on the car.
The low speed region, generally below about 50 millimeters per second of shaft velocity, corresponds to movements caused by the car managing its own mass. Body roll as the car turns, pitch as the driver brakes, and the settling of the platform after a direction change all occur at relatively low shaft speeds. Damping in this region determines how the car carries its weight and how quickly it stabilizes.
The high speed region corresponds to movements forced on the wheel by the road surface. Hitting a curb, crossing a bump, or running over a patch of broken pavement moves the shaft quickly regardless of what the chassis is doing. Damping in this region determines how much of that input reaches the chassis and how well the tire stays in contact with the road.
Compression and rebound are tuned separately. Compression damping resists the shaft moving into the shock body, which happens as the wheel moves up toward the chassis. Rebound damping resists the shaft moving back out as the suspension extends. A shock can be built to resist compression heavily and rebound lightly, or any combination of the two, and the relationship between them affects how the car behaves after it has absorbed something.
What determines the shape of the curve
Three groups of internal components establish the curve, and they do not act independently of one another.
The piston is the part attached to the end of the shaft that moves through the oil inside the shock body. Oil must pass from one side of the piston to the other as the shaft moves, and it does so through ports machined into the piston face. The number, size, and arrangement of those ports set the baseline flow characteristic of the shock. A piston with large ports allows oil through easily and produces a lower overall force level than one with restricted ports.
The shim stack controls the rest. Shims are thin steel discs, typically a few thousandths of an inch thick, stacked against the face of the piston so that they cover the ports. They function as a pressure-sensitive valve. At low shaft velocities, oil pressure is not high enough to deflect the shims, so the oil is forced through a small bleed path and the shock produces relatively high force for the speed. As shaft velocity rises, pressure builds against the shims until they begin to bend away from the piston face, opening a larger flow area and limiting how steeply force continues to rise.
The specific shims chosen determine where that transition happens and how gradual it is. A thicker shim requires more pressure to deflect, which moves the opening point to a higher velocity. A smaller diameter shim deflects more easily. The order in which shims of different diameters are stacked changes how progressively the stack opens rather than simply when. Changes at this level are measured in thousandths of an inch, and a single shim substitution can alter the curve across a range of velocities rather than at one point.
The adjusters provide external adjustment without disassembly. Most racing shocks include one or more adjusters that open a bleed circuit, allowing a metered amount of oil to bypass the main valving. Because bleed flow matters most when overall flow is low, adjusters primarily move the low speed portion of the curve. This is why teams adjust shocks at the track using the adjusters and change shim stacks back at the shop.
The reason curve prediction has historically been difficult is that these three things interact. A given shim change produces a different result depending on the piston it is working against, the other shims in the stack, the oil in the shock, and the gas pressure behind the floating piston or in the reservoir. There is no simple arithmetic that converts a build specification into a curve.
Shops have handled this by accumulating experience. A builder who has assembled and tested a large number of shocks develops a reliable sense of what a given change will do, and a well-organized shop keeps records of past builds with the curves they produced. That knowledge works well near combinations the shop has built before and works poorly at the edges, because a record of two builds does not describe what a build between them would produce.
Can machine learning predict a damper curve?
It can, within limits that are worth stating clearly. Penske Racing Shocks has been supplying this capability to sports car customers before it became part of a software product, under the name DCML, which stands for Damper Curve Machine Learning.
Aaron Lambert describes it as a way to build a dyno graph without running the dyno. An engineer enters a shock and a build specification, and the software plots the curve that combination should produce, including the effect of each adjuster position on that curve.
The method is worth understanding because machine learning is applied loosely to a lot of products. The software does not model fluid dynamics and does not calculate shock behavior from physical first principles. It is trained on measured data from physical shocks. Penske builds dampers, runs them on dynos, and records each measured curve alongside the complete specification that produced it: piston, shim stack, adjuster settings, and the rest of the build. Across a large enough set of builds, the relationship between specification and resulting curve becomes something a model can learn to reproduce.
This is also why the model has boundaries. It knows what it has been shown.
What is PASS?
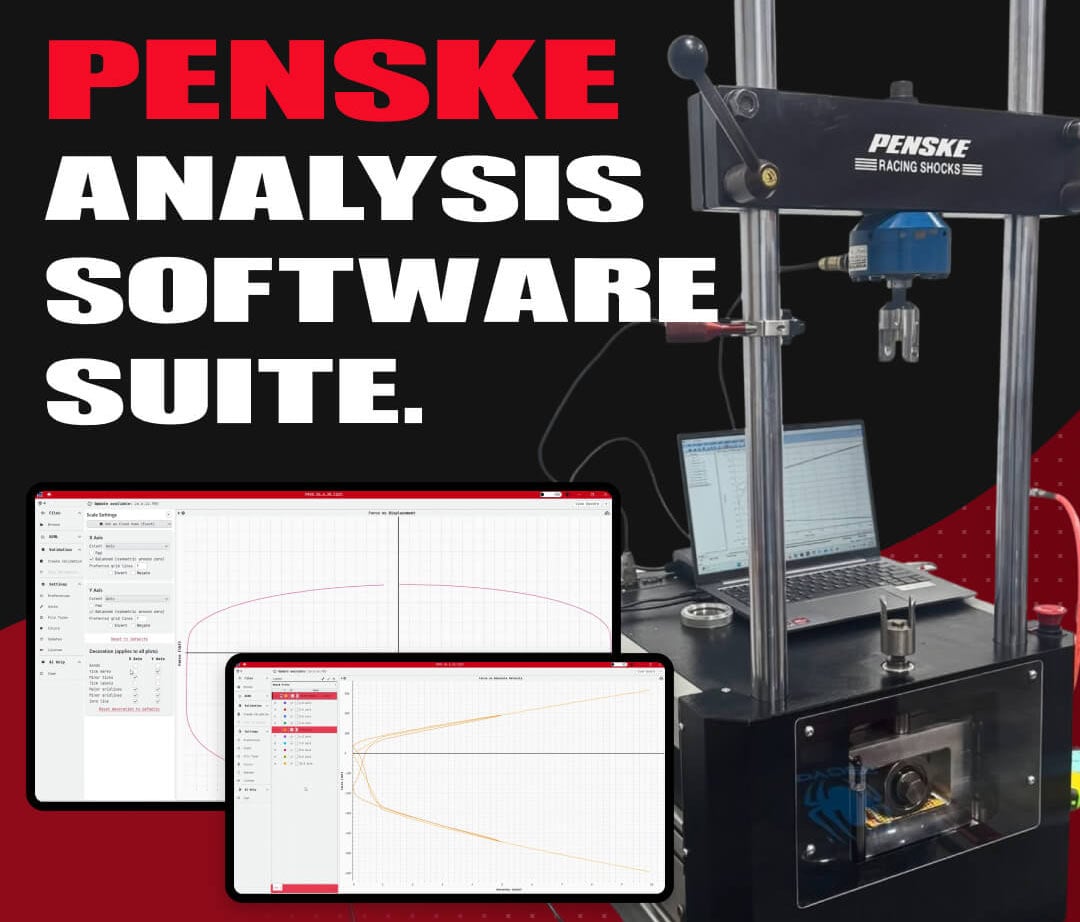
PASS stands for Penske Analysis Software Suite. It is shock dyno analysis software for Windows, built by Penske Racing Shocks to replace Shock 6 in racing applications.
Shock 6 is the program most shops in this industry have used for the past twenty years. Roehrig Engineering wrote it to accompany its dynos, and it became the common tool for building tests, capturing data, and analyzing damper curves. Roehrig was acquired by MTS Systems in 2014, MTS was acquired by Amphenol in 2021, and the test business was sold to ITW later that year. The current version of Shock 6 dates to 2022 and was primarily a Windows compatibility update. The software still works, but it is no longer being developed for racing.
Penske Racing Shocks has been the largest source of this hardware in North American racing for years, services these machines, and runs them in its own facility. When development stopped, we bought the remaining licenses, brought the original Shock 6 software author back in, and built PASS from the ground up.
PASS is organized into modules that can be licensed separately.
Shock7 is the module for building dyno tests and capturing the resulting data. It includes predefined test templates for common race series, so a shop running a spec class can select the required test rather than configuring it each time, and it produces the standard analysis plots: force versus velocity, force versus displacement, gas force, and seal drag.
DCML is the machine learning module described in this article, which predicts damper curves from build specifications and works in reverse to return a build from a target curve.
Demo Mode is free and does not expire. It opens any PASS file or any existing Shock 6 file and includes the complete set of analysis tools available in the paid modules. It does not build tests or capture data. Roehrig offered a free viewer for years and most shock builders kept a copy on a second computer for reviewing data away from the dyno, and PASS continues that.
Three details matter to shops considering a change. PASS opens existing Shock 6 files, so an archive of past runs remains usable. Licensing is handled with keys tied to an account rather than the USB dongle Shock 6 requires, so a failed or lost dongle no longer locks a shop out of its own data. And PASS supports most Penske and Roehrig dyno hardware built in the last decade, with many machines requiring the software alone. Older units may need a hardware update, which we can confirm from a dyno serial number.
Predicting a curve from a build, and a build from a curve
The software works in two directions.
In the forward direction, the engineer supplies a build specification and receives the predicted curve. This answers whether a proposed combination will land near the target before anyone assembles it.
In the reverse direction, the engineer supplies the curve. The target curve is created by dragging points on the plot until its shape matches what the car needs, and the software returns the piston, shim stack, and adjuster settings that should produce it. This is the inverse of standard practice. Rather than building a shock to discover its curve, the engineer describes the curve and receives a specification to evaluate, which moves the search for a starting point out of the shop and into the software.
How accurate is a predicted damper curve?
Predictions are typically within one to two percent of the curve subsequently measured on a dyno.
In practical terms, that level of accuracy is enough to reduce the number of physical test shocks substantially, because the predicted build is a serious candidate rather than a rough direction. It is not enough to certify a damper without testing it. Predicted curves can be overlaid against measured runs inside the software for direct comparison, which is the intended workflow.
Does curve prediction work on other brands of damper?
It can be used with them, though its predictive accuracy depends on the training data.
The model was trained on Penske dampers, so Penske dampers are where the predictions hold. Given a target curve on a Penske shock, the model will identify the piston and shim stack that produce it. Shocks from other manufacturers can still have their measured curves loaded, plotted, and analyzed, and an engineer can use the software to study how build changes affect curve shape in general terms. The software will not prescribe a shim stack for hardware it has no training data for.
Penske is also developing an additional training set covering the standard pistons and valving combinations used across other categories of racing, which extends the range of builds the model can address.
Does curve prediction replace dyno testing?
No. A model trained on build specifications predicts what a configuration produced under the conditions in which it was measured. Several things that affect a real shock on a real day are outside what the specification describes.
Oil viscosity changes as the shock heats up, so a shock measured cold reads differently from the same shock measured after repeated cycling. Seal friction varies between individual assemblies and changes as components wear. Gas pressure drifts over time. Two technicians building to the same specification can produce shocks that measure slightly differently from each other, and detecting that variation is one of the reasons a shop owns a dyno.
What prediction changes is when the dyno is used. Instead of spending dyno time searching through candidate builds, the shop spends it confirming a specification that already has reason behind it.
Seeing it against your own data
The way to evaluate curve prediction is to give it targets you already know the answer to. Take a build your shop has run, let the software predict the curve, and compare it against the run sitting in your files. That comparison tells an experienced builder more in ten minutes than any description of the method.
Demo Mode is free and opens your existing Shock 6 files, so the analysis side can be tried without licensing anything. For a look at what prediction does with your own targets, contact us or request access through the PASS page. Licensing, pricing, and dyno integration are handled by our team in North Carolina, who can also confirm from a serial number whether a given dyno needs anything beyond the software.